Metric
Monitoring Access
The go-zero framework integrates service metrics monitoring based on prometheus. However, it is not explicitly turned on and needs to be configured in config.yaml by the developer as follows.
Prometheus:
  Host: 127.0.0.1
  Port: 9091
  Path: /metrics
If the developer is building Prometheus locally, the configuration file prometheus.yaml in Prometheus needs to write the configuration that needs to collect the service monitoring information.
- job_name: 'file_ds'
    static_configs:
      - targets: ['your-local-ip:9091']
        labels:
          job: activeuser
          app: activeuser-api
          env: dev
          instance: your-local-ip:service-port
Because it is run locally with docker. Place prometheus.yaml in the docker-prometheus directory.
docker run \
    -p 9090:9090 \
    -v dockeryml/docker-prometheus:/etc/prometheus \
    prom/prometheus
Open localhost:9090 and you can see.
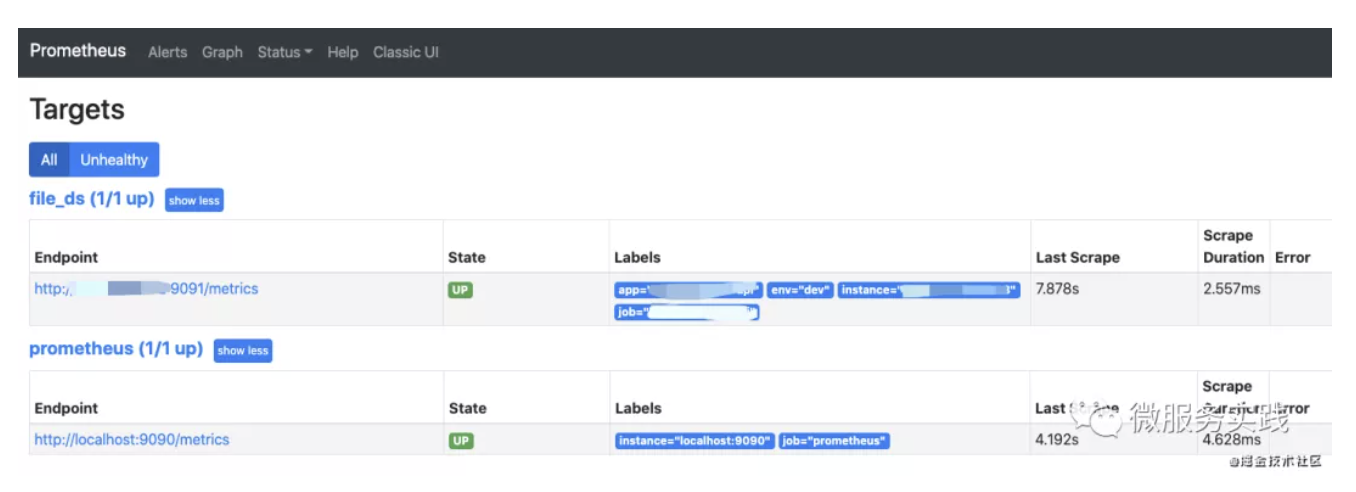
By clicking on http://service-ip:9091/metrics you can see the monitoring information for this service.
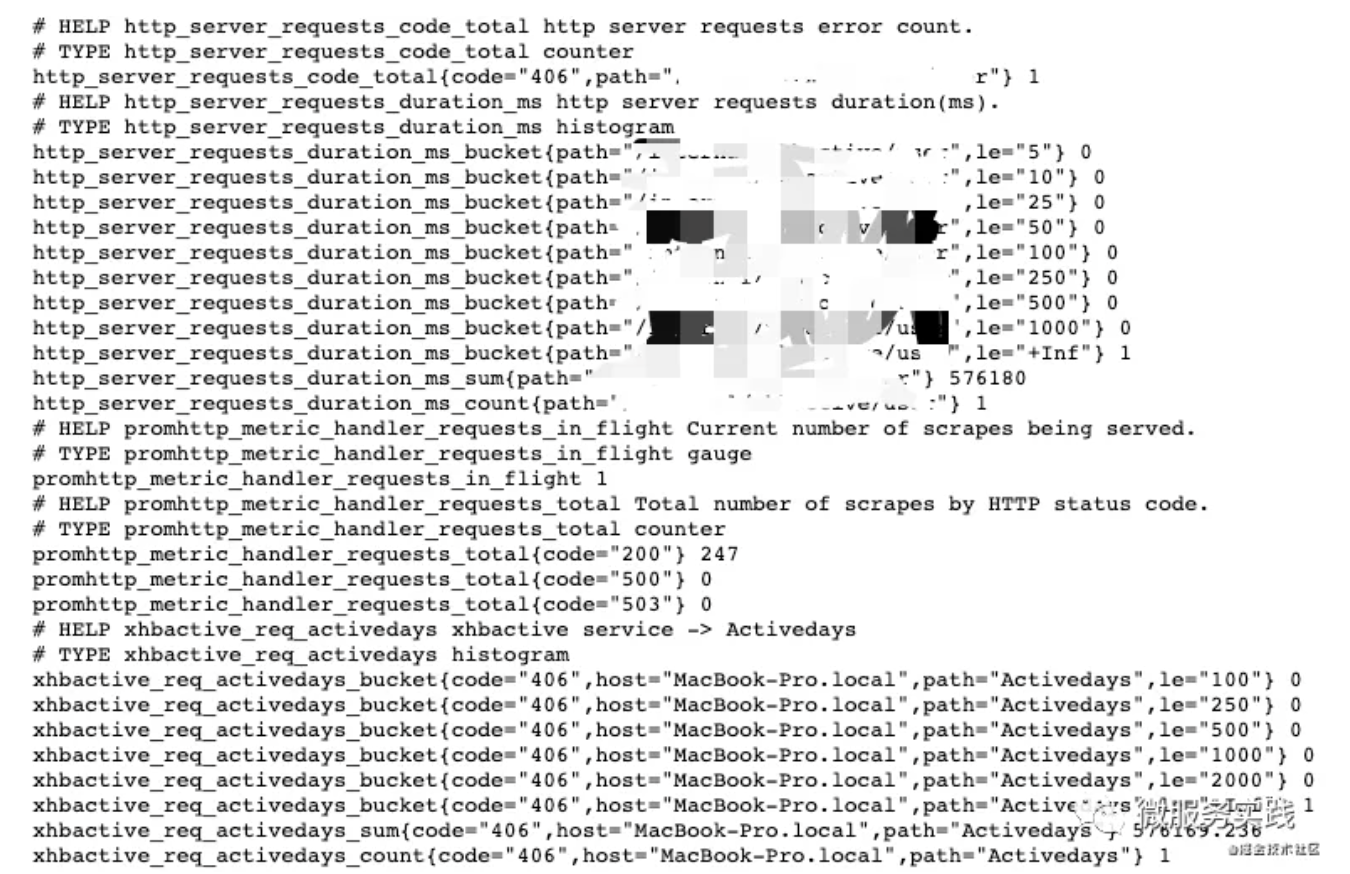
Above we can see that there are two kinds of bucket, and count/sum metrics.
How does go-zero integrate monitoring metrics? What metrics are being monitored? How do we define our own metrics? Here's an explanation of these questions
tip
For basic access to the above, see our other article: https://zeromicro.github.io/go-zero/service-monitor.html
How to integrate
The request method in the above example is HTTP, which means that the monitoring metrics data is continuously collected when requesting the server side. It is easy to think of the middleware function, the specific code.
var (
 metricServerReqDur = metric.NewHistogramVec(&metric.HistogramVecOpts{
  ...
    // Monitoring Indicators
  Labels:    []string{"path"},
    // Histogram distribution in which the buckets of statistics
  Buckets:   []float64{5, 10, 25, 50, 100, 250, 500, 1000},
 })

 metricServerReqCodeTotal = metric.NewCounterVec(&metric.CounterVecOpts{
  ...
    // Monitor indicators: directly in the record indicator incr() can be
  Labels:    []string{"path", "code"},
 })
)

func PromethousHandler(path string) func(http.Handler) http.Handler {
 return func(next http.Handler) http.Handler {
  return http.HandlerFunc(func(w http.ResponseWriter, r *http.Request) {
      // Time of request for access
   startTime := timex.Now()
   cw := &security.WithCodeResponseWriter{Writer: w}
   defer func() {
        // Time of request return
    metricServerReqDur.Observe(int64(timex.Since(startTime)/time.Millisecond), path)
    metricServerReqCodeTotal.Inc(path, strconv.Itoa(cw.Code))
   }()
   // Middleware release, after executing subsequent middleware and business logic. Rejoin here and do a metric upload of the complete request
   // [🧅: The Onion Model]
   next.ServeHTTP(cw, r)
  })
 }
}
The whole thing is actually quite simple.
- HistogramVec is responsible for request time collection.
- The bucket holds the time consumption indicator specified by the option. A request will be aggregated and counted by the corresponding bucket.
- The final display is the distribution of a route in different time consumption, very intuitive to provide developers can optimize the area.
- CounterVec is responsible for specifying labels to collect.
- Labels: []string{"path", "code"}
- labels is equivalent to a tuple. go-zero is a record of the number of times different status codes are returned for different routes, using (path, code) as a whole. If there are too many 4xx,5xx, shouldn't you look at the health of your service?
How to customize
The go-zero also provides the prometheus metric basic wrapper for developers to develop their own prometheus middleware.
| Name | Usage | Search Functions |
|---|---|---|
| CounterVec | A single count. Usage: QPS statistics | CounterVec.Inc() Indicator+1 |
| GuageVec | Single metric record. Used for disk capacity, CPU/Mem usage (can be increased or decreased) | GuageVec.Inc()/GuageVec.Add() Indicator +1/Indicator plus N, can also be a negative number |
| HistogramVec | The distribution of the response values. Apply to: request elapsed time, response size | HistogramVec.Observe(val, labels) Record the current corresponding value of the indicator and find the bucket where the value is located, +1 |
Also for HistogramVec.Observe() Do a basic analysis:
We can actually see that each HistogramVec statistic in the above chart has 3 sequences that appear.
- _count: number of data
- _sum: sum of all data
- _bucket{le=a1}: the number of data in [-inf, a1]
So we also guess that during the counting process, 3 types of data are counted.
// Basically the statistics in prometheus are counted using the atomic CAS method
// performance is higher than using Mutex
func (h *histogram) observe(v float64, bucket int) {
 n := atomic.AddUint64(&h.countAndHotIdx, 1)
 hotCounts := h.counts[n>>63]

 if bucket < len(h.upperBounds) {
    // val Corresponding data bucket +1
  atomic.AddUint64(&hotCounts.buckets[bucket], 1)
 }
 for {
  oldBits := atomic.LoadUint64(&hotCounts.sumBits)
  newBits := math.Float64bits(math.Float64frombits(oldBits) + v)
    // sum indicator value +v (after all, it is the total sum)
  if atomic.CompareAndSwapUint64(&hotCounts.sumBits, oldBits, newBits) {
   break
  }
 }
 // count Statistics +1
 atomic.AddUint64(&hotCounts.count, 1)
}
So developers want to define their own monitoring metrics: the
- Specify the middleware to be generated in the goctl generation API code: https://zeromicro.github.io/go-zero/middleware.html
- Write your own metrics logic in the middleware file
- Of course, the developer can also write the metrics logic for the statistics in the business logic. Same as above.
The above is all for the HTTP part of the logic parsing, the RPC part of the logic is similar, you can see the design in the interceptor section.